
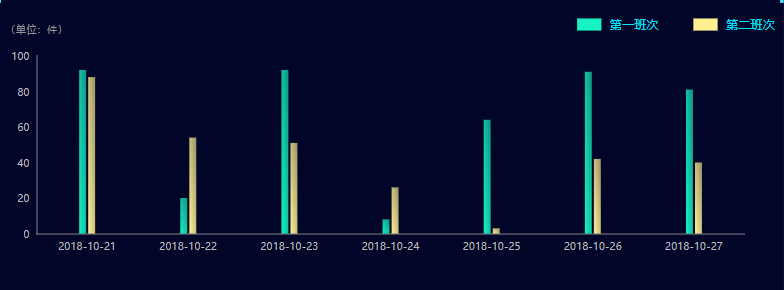
柱状图使用示例(仅供参考)
柱状图类型(正常)
- 表现形式(正常)
- 配置
js
// 接口数据
const res = {
cpbd_load_dt: ["2018-10-21","2018-10-22","2018-10-23","2018-10-24","2018-10-25","2018-10-26","2018-10-27"],
data:[["92.0","20.0","92.0","8.0","64.0","91.0","81.0"],["88.0","54.0","51.0","26.0","3.0","42.0","40.0"]]
}
// 图表配置
option = {
legend: {
icon: 'rect', //图例形状
data: [
{ name: '第一班次', itemStyle: { color: '#17f2c3' } },
{ name: '第二班次', itemStyle: { color: '#fff092' } },
],
top: '12px',
right: '0',
itemWidth: 28, // 图例标记的图形宽度。
itemHeight: 14, // 图例标记的图形高度。
itemGap: 40, // 图例每项之间的间隔。
textStyle: {
fontSize: 14,
color: '#00E4FF',
padding: [0, 5],
},
},
grid: {
left: '40',
right: '40',
bottom: '50',
top: '60',
containLabel: false,
},
xAxis: {
type: 'category',
splitLine: {
show: false,
},
axisTick: {
show: false,
},
data: res.cpbd_load_dt,
axisLine: {
// 改变y轴颜色
show: true,
lineStyle: {
color: '#979797',
width: 1,
},
},
axisLabel: {
// 改变x轴字体颜色和大小
color: '#bbbbbb',
fontSize: 12,
},
},
yAxis: {
name: '(单位:件)',
nameTextStyle: {
padding: [0, 0, 10, 0],
},
splitLine: {
show: false,
},
axisTick: {
show: false,
},
axisLine: {
show: true,
lineStyle: {
color: '#979797',
type: 'solid',
width: 1,
},
},
axisLabel: {
interval: 0,
color: '#bbbbbb',
fontSize: 12,
},
},
tooltip: {
trigger: 'axis',
backgroundColor: 'rgba(29,30,121,0.70)',
borderColor: 'rgba(29,30,121,0.70)',
padding: 0,
extraCssText: 'background: rgba(29,30,121,0.70)',
formatter: function (params) {
let html = ` <p style='background: #0C4D91;border-radius: 4px 4px 0 0; text-indent:9px;line-height: 30px;font-size: 16px; color: #FFFFFF;'>
${params[0].name}</p>`;
params.forEach((item) => {
html +=
'<p style="margin-left:9px;margin-right:9px;">' +
'<span style="display:inline-block;margin-right:4px;border-radius:50%;width:10px;height:10px;left:5px;background-color:' +
item.color +
'"></span>' +
'<span style="font-size: 16px; color: #17f2c3;">' +
item.seriesName +
' : </span>' +
'<span style="font-size: 16px; color: #ffffff;">' +
item.value +
'</span>' +
'</p>';
});
return html;
},
},
series: [
{
type: 'bar',
name: '第一班次',
barGap: '30%',
itemStyle: {
color: new echarts.graphic.LinearGradient(0, 1, 1, 0, [
{
offset: 0,
color: 'rgba(23,242,195,1)',
},
{
offset: 1,
color: 'rgba(23,242,195,0.6)',
},
]),
},
barWidth: 8,
data: res.data[0],
},
{
type: 'bar',
name: '第二班次',
label: {
show: false,
},
barGap: '30%',
itemStyle: {
color: new echarts.graphic.LinearGradient(0, 1, 1, 0, [
{
offset: 0,
color: 'rgba(255,240,146,1)',
},
{
offset: 1,
color: 'rgba(255,240,146,0.6)',
},
]),
},
barWidth: 8,
data: res.data[1],
},
],
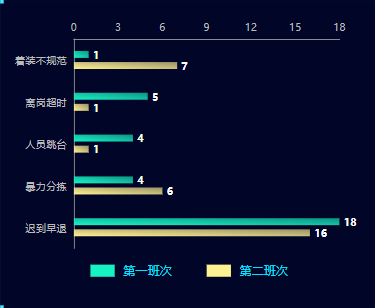
}柱状图类型(横向)
- 表现形式(横向)
- 配置
js
// 接口数据
const res = {
jsonData: [[18, 4, 4, 5, 1], [16, 6, 1, 1, 7]]
}
// 图表配置
option = {
legend: {
orient: 'horizontal',
icon: 'rect', //图例形状
data: [
{ name: '第一班次', itemStyle: { color: '#17f2c3' } },
{ name: '第二班次', itemStyle: { color: '#fff092' } },
],
top: '12px',
right: '0',
itemWidth: 28, // 图例标记的图形宽度。
itemHeight: 14, // 图例标记的图形高度。
itemGap: 40, // 图例每项之间的间隔。
textStyle: {
fontSize: 14,
color: '#00E4FF',
padding: [0, 5],
},
},
grid: {
left: '80',
right: '40',
bottom: '50',
top: '40',
containLabel: false,
},
xAxis: {
type: 'value',
position: 'top',
splitLine: {
show: false,
},
axisTick: {
show: false,
},
axisLine: {
// 改变y轴颜色
show: true,
lineStyle: {
color: '#979797',
width: 1,
},
},
axisLabel: {
// 改变x轴字体颜色和大小
color: '#bbbbbb',
fontSize: 12,
},
},
yAxis: {
type: 'category',
data: ['迟到早退', '暴力分拣', '人员跳台', '离岗超时', '着装不规范'],
splitLine: {
show: false,
},
axisTick: {
show: false,
},
axisLine: {
show: true,
lineStyle: {
color: '#979797',
type: 'solid',
width: 1,
},
},
axisLabel: {
interval: 0,
color: '#bbbbbb',
fontSize: 12,
},
},
series: [
{
type: 'bar',
name: '第一班次',
label: {
show: true,
position: 'right',
color: '#ffffff',
fontWeight: 600,
},
barGap: '60%',
itemStyle: {
color: new echarts.graphic.LinearGradient(0, 1, 1, 0, [
{
offset: 0,
color: 'rgba(23,242,195,1)',
},
{
offset: 1,
color: 'rgba(23,242,195,0.6)',
},
]),
borderWidth: 2,
},
barWidth: 8,
data: res.jsonData[0],
},
{
type: 'bar',
name: '第二班次',
label: {
show: false,
},
label: {
show: true,
position: 'right',
color: '#ffffff',
fontWeight: 600,
},
barGap: '60%',
itemStyle: {
color: new echarts.graphic.LinearGradient(0, 1, 1, 0, [
{
offset: 0,
color: 'rgba(255,240,146,1)',
},
{
offset: 1,
color: 'rgba(255,240,146,0.6)',
},
]),
borderWidth: 2,
},
barWidth: 8,
data: res.jsonData[1],
},
],
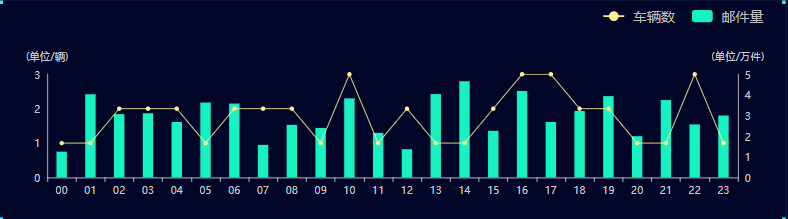
}柱状图类型(柱状及折线)
- 1.表现形式(柱状及折线)
- 2.配置
js
// 接口数据
const res = {
ad_cars: ["1.0","1.0","2.0","2.0","2.0","1.0","2.0","2.0","2.0","1.0","3.0","1.0","2.0","1.0","1.0","2.0","3.0","3.0","2.0","2.0","1.0","1.0","3.0","1.0"],
ad_mails: ["12466.0","40251.0","30685.0","31117.0","26931.0","36337.0","35836.0","15793.0","25483.0","23993.0","38345.0","21571.0","13677.0","40433.0","46645.0","22586.0","41918.0","26900.0","32187.0","39391.0","20032.0","37526.0","25718.0","30000.0"],
cpbd_load_dt_hh:["2018-10-28 00","2018-10-28 01","2018-10-28 02","2018-10-28 03","2018-10-28 04","2018-10-28 05","2018-10-28 06","2018-10-28 07","2018-10-28 08","2018-10-28 09","2018-10-28 10","2018-10-28 11","2018-10-28 12","2018-10-28 13","2018-10-28 14","2018-10-28 15","2018-10-28 16","2018-10-28 17","2018-10-28 18","2018-10-28 19","2018-10-28 20","2018-10-28 21","2018-10-28 22","2018-10-28 23"]
}
// 处理数据
for (let i = 0; i < res.ad_mails.length; i++) {
if (res.ad_mails[i] !== '0.00') {
res.ad_mails[i] = (res.ad_mails[i] / 10000).toFixed(2);
}
}
// x轴只显示小时
for (let j = 0; j < res.cpbd_load_dt_hh.length; j++) {
res.cpbd_load_dt_hh[j] = res.cpbd_load_dt_hh[j].substring(11, 13);
}
// 图表配置
option = {
legend: {
data: ['车辆数', '邮件量'],
itemWidth: 24, // 图例标记的图形宽度。[ default: 25 ]
itemHeight: 14, // 图例标记的图形高度。[ default: 14 ]
itemGap: 20, // 图例每项之间的间隔。[ default: 10 ]横向布局时为水平间隔,纵向布局时为纵向间隔。
right: '16',
textStyle: {
fontSize: 16,
color: '#bbbbbb',
padding: [0, 5],
},
},
tooltip: {
trigger: 'axis',
backgroundColor: 'rgba(29,30,121,0.70)',
borderColor: 'rgba(29,30,121,0.70)',
padding: 0,
extraCssText: 'background: rgba(29,30,121,0.70)',
formatter: function (params) {
console.log(params);
let html = ` <p style='background: #0C4D91;border-radius: 4px 4px 0 0; text-indent:9px;line-height: 30px;font-size: 16px; color: #FFFFFF;'>
${params[0].name}</p>`;
params.forEach((item) => {
html +=
'<p style="margin-left:9px;margin-right:9px;">' +
'<span style="display:inline-block;margin-right:4px;border-radius:50%;width:10px;height:10px;left:5px;background-color:' +
item.color +
'"></span>' +
'<span style="font-size: 16px; color: #fff092;">' +
item.seriesName +
' : </span>' +
'<span style="font-size: 16px; color: #ffffff;">' +
item.value +
'</span>' +
'</p>';
});
return html;
},
xAxis: [
{
type: 'category',
data: res.cpbd_load_dt_hh,
axisLine: {
lineStyle: {
color: '#ccc',
},
},
},
],
yAxis: [
{
name: '(单位/辆)',
type: 'value',
splitLine: { show: false },
interval: 1,
axisLine: {
show: true,
lineStyle: {
color: '#ccc',
},
},
},
{
name: '(单位/万件)',
type: 'value',
min: 0,
splitLine: { show: false },
axisLabel: {
formatter: '{value}',
},
axisLine: {
show: true,
lineStyle: {
color: '#ccc',
},
},
},
],
series: [
{
name: '车辆数',
type: 'line',
symbol: 'circle',
yAxisIndex: 0,
symbolSize: 5,
color: '#fff092',
lineStyle: {
width: 1,
},
emphasis: {
focus: 'series',
},
data: res.ad_cars,
},
{
name: '邮件量',
type: 'bar',
color: '#17f2c3',
yAxisIndex: 1,
emphasis: {
focus: 'series',
},
barWidth: 12,
data: res.ad_mails,
},
],
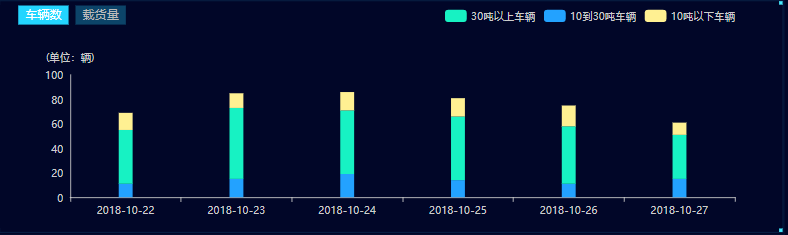
},柱状图类型(堆叠)
- 1.表现形式(堆叠)
- 2.配置
js
// 接口数据
const res = {
// 车辆载货量的数据(例子中不涉及)
seriesDataMail:[
["190412","245399","294760","192615","215360","276467"],
["612554","486083","572294","644222","604574","665866"],
["291788","210524","115676","227392","196125","118472"]
],
// 车辆数数据
seriesDataVehicles:[
["17","12","22","11","13","5"],
["58","60","69","63","45","50"],
["21","17","11","19","14","10"]
],
xAxisData:["2018-10-22","2018-10-23","2018-10-24","2018-10-25","2018-10-26","2018-10-27"]
}
// 图表配置
option = {
legend: {
orient: 'horizontal',
data: [{ name: '30吨以上车辆' }, { name: '10到30吨车辆' }, { name: '10吨以下车辆' }],
right: '5%',
textStyle: {
color: '#ccc',
},
},
grid: {
left: '80',
right: '50',
bottom: '20',
top: '80',
},
xAxis: {
data: res.xAxisData,
axisLine: {
lineStyle: {
color: '#ccc',
},
},
},
yAxis: {
name: '(单位:件)',
type: 'value',
splitLine: {
show: false,
},
axisLine: {
show: true,
lineStyle: {
color: '#ccc',
},
},
},
tooltip: {
trigger: 'axis',
backgroundColor: 'rgba(29,30,121,0.70)',
borderColor: 'rgba(29,30,121,0.70)',
padding: 0,
extraCssText: 'background: rgba(29,30,121,0.70)',
formatter: function (params) {
let html = ` <p style='background: #0C4D91;border-radius: 4px 4px 0 0; text-indent:9px;line-height: 30px;font-size: 16px; color: #FFFFFF;'>
${params[0].name}</p>`;
params.forEach((item) => {
html +=
'<p style="margin-left:9px;margin-right:9px;">' +
'<span style="display:inline-block;margin-right:4px;border-radius:50%;width:10px;height:10px;left:5px;background-color:' +
item.color +
'"></span>' +
'<span style="font-size: 16px; color: #17f2c3;">' +
item.seriesName +
' : </span>' +
'<span style="font-size: 16px; color: #ffffff;">' +
item.value +
'</span>' +
'</p>';
});
return html;
},
},
series: [
{
name: '10到30吨车辆',
type: 'bar',
yAxisIndex: 0,
barWidth: 16,
itemStyle: {
color: 'rgba(35, 162, 255, 1)',
},
data: res.seriesDataVehicles[0],
stack: '1',
},
{
name: '30吨以上车辆',
type: 'bar',
yAxisIndex: 0,
barWidth: 16,
itemStyle: {
color: 'rgba(23, 242, 195, 1)',
},
data: res.seriesDataVehicles[1],
stack: '1',
},
{
name: '10吨以下车辆',
type: 'bar',
yAxisIndex: 0,
barWidth: 16,
itemStyle: {
color: 'rgba(255, 240, 146, 1)',
},
data: res.seriesDataVehicles[2],
stack: '1',
},
],
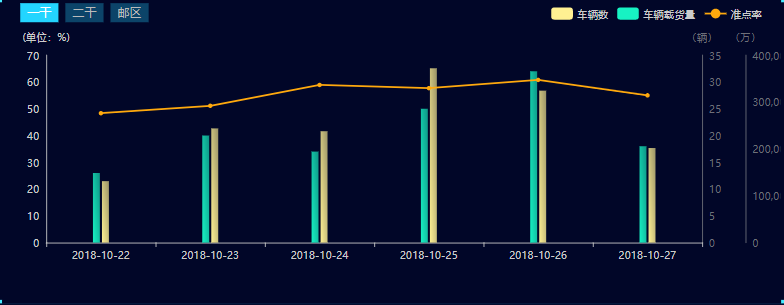
}柱状图类型(柱状及折线三种不同单位统计)
- 1.表现形式(柱状及折线三种不同单位统计)
- 2.温馨提示
注意事项
yAxisIndex要与yAxis对应上,从0开始,series中的数据不设置yAxisIndex,默认为0
- 3.配置
js
// 接口数据
const res = {
ad_cars: ["13.0", "20.0", "17.0", "25.0", "32.0", "18.0"],
ad_mail: ["131174.0", "243776.0", "237752.0", "372128.0", "324362.0", "201888.0"],
ad_on_time_ratio: ["48.33", "51.11", "58.89", "57.69", "60.77", "55.00"]
cpbd_load_dt: ["2018-10-22", "2018-10-23", "2018-10-24", "2018-10-25", "2018-10-26", "2018-10-27"]
}
// 图表配置
option = {准点率
legend: {
data: [
{ name: '车辆数', itemStyle: { color: '#fff092' } },
{ name: '车辆载货量', itemStyle: { color: '#17f2c3' } },
{ name: '准点率' },
],
right: '16',
textStyle: {
color: '#ccc',
},
},
grid: {
left: '50',
right: '90',
bottom: '50',
},
xAxis: {
data: res.cpbd_load_dt,
axisLine: {
lineStyle: {
color: '#ccc',
},
},
},
yAxis: [
{
name: '(单位:%)',
type: 'value',
splitLine: { show: false },
position: 'left',
axisLine: {
show: true,
lineStyle: {
color: '#ccc',
},
},
},
{
type: 'value',
name: '(辆)',
min: 0,
position: 'right',
splitLine: { show: false },
axisLine: {
show: true,
lineStyle: {
color: '#ccc',
},
},
axisLabel: {
formatter: '{value}',
},
},
{
type: 'value',
name: '(万)',
min: 0,
position: 'right',
offset: 50,
splitLine: { show: false },
axisLine: {
show: true,
lineStyle: {
color: '#ccc',
},
},
axisLabel: {
formatter: '{value}',
},
},
],
tooltip: {
trigger: 'axis',
backgroundColor: 'rgba(29,30,121,0.70)',
borderColor: 'rgba(29,30,121,0.70)',
padding: 0,
extraCssText: 'background: rgba(29,30,121,0.70)',
formatter: function (params) {
let html = ` <p style='background: #0C4D91;border-radius: 4px 4px 0 0; text-indent:9px;line-height: 30px;font-size: 16px; color: #FFFFFF;'>
${params[0].name}</p>`;
params.forEach((item) => {
html +=
'<p style="margin-left:9px;margin-right:9px;">' +
'<span style="display:inline-block;margin-right:4px;border-radius:50%;width:10px;height:10px;left:5px;background-color:' +
item.color +
'"></span>' +
'<span style="font-size: 16px; color: #17f2c3;">' +
item.seriesName +
' : </span>' +
'<span style="font-size: 16px; color: #ffffff;">' +
item.value +
'</span>' +
'</p>';
});
return html;
},
},
series: [
{
name: '车辆数',
type: 'bar',
// yAxisIndex要与yAxis对应上 从0开始
yAxisIndex: 1,
barWidth: 8,
barGap: '30%',
itemStyle: {
color: new echarts.graphic.LinearGradient(0, 1, 1, 0, [
{
offset: 0,
color: 'rgba(23,242,195,1)',
},
{
offset: 1,
color: 'rgba(23,242,195,0.6)',
},
]),
},
data: res.ad_cars,
},
{
name: '车辆载货量',
type: 'bar',
barWidth: 8,
barGap: '30%',
// yAxisIndex要与yAxis对应上
yAxisIndex: 2,
itemStyle: {
color: new echarts.graphic.LinearGradient(0, 1, 1, 0, [
{
offset: 0,
color: 'rgba(255,240,146,1)',
},
{
offset: 1,
color: 'rgba(255,240,146,0.6)',
},
]),
},
data: res.ad_mail,
},
{
name: '转载率',
type: 'line',
symbol: 'circle',
symbolSize: 5,
showAllSymbol: 'auto',
lineStyle: {
color: '#ffa90d',
},
color: '#ffa90d',
data: res.ad_on_time_ratio,
},
],
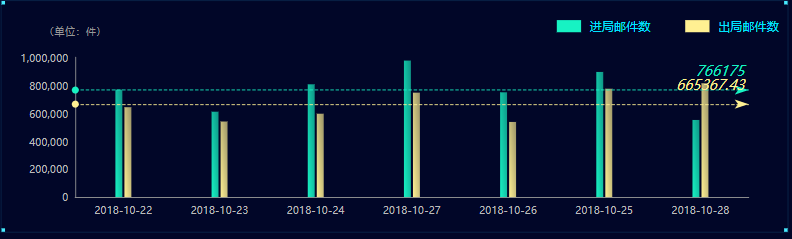
}柱状图类型(平均值刻度线)
- 1.表现形式(平均值刻度线)
- 2.配置
提示
平均刻度是数据是后台给返回的数据,前端也可以自己计算数组的平均值。markLineData字段就是平均值
要在图表中使用渐变需要在文件下引入echarts,使用如:
color: new echarts.graphic...
js
// 接口数据
const res = {
cpbd_load_dt: ["2018-10-22", "2018-10-23", "2018-10-24", "2018-10-27", "2018-10-26", "2018-10-25", "2018-10-28"],
arriveMail:{
data: ["769115", "611176", "807417", "977340", "750145", "895895", "552137"],
markLineData: 766175
}
departMail:{
data: ["643436", "540996", "596797", "747598", "537959", "775735", "815051"],
markLineData: 665367.43
}
}
// 图表配置
option = {
legend: {
icon: 'rect', //图例形状
data: [
{ name: '进局邮件数', itemStyle: { color: '#17f2c3' } },
{ name: '出局邮件数', itemStyle: { color: '#fff092' } },
],
top: '12px',
right: '0',
itemWidth: 28, // 图例标记的图形宽度。
itemHeight: 14, // 图例标记的图形高度。
itemGap: 40, // 图例每项之间的间隔。
textStyle: {
fontSize: 14,
color: '#00E4FF',
padding: [0, 5],
},
},
grid: {
left: '80',
right: '40',
bottom: '20',
top: '60',
containLabel: false,
},
xAxis: {
type: 'category',
splitLine: {
show: false,
},
axisTick: {
show: false,
},
data: res.cpbd_load_dt,
axisLine: {
// 改变y轴颜色
show: true,
lineStyle: {
color: '#979797',
width: 1,
},
},
axisLabel: {
// 改变x轴字体颜色和大小
color: '#bbbbbb',
fontSize: 12,
},
},
yAxis: {
name: '(单位:件)',
nameTextStyle: {
padding: [0, 0, 10, 0],
},
splitLine: {
show: false,
},
axisTick: {
show: false,
},
axisLine: {
show: true,
lineStyle: {
color: '#979797',
type: 'solid',
width: 1,
},
},
axisLabel: {
interval: 0,
color: '#bbbbbb',
fontSize: 12,
},
},
tooltip: {
trigger: 'axis',
backgroundColor: 'rgba(29,30,121,0.70)',
borderColor: 'rgba(29,30,121,0.70)',
padding: 0,
extraCssText: 'background: rgba(29,30,121,0.70)',
formatter: function (params) {
let html = ` <p style='background: #0C4D91;border-radius: 4px 4px 0 0; text-indent:9px;line-height: 30px;font-size: 16px; color: #FFFFFF;'>
${params[0].name}</p>`;
params.forEach((item) => {
const color = item.color.colorStops ? item.color.colorStops[0].color : item.color;
html +=
'<p style="margin-left:9px;margin-right:9px;">' +
'<span style="display:inline-block;margin-right:4px;border-radius:50%;width:10px;height:10px;left:5px;background-color:' +
color +
'"></span>' +
'<span style="font-size: 16px; color: #17f2c3;">' +
item.seriesName +
' : </span>' +
'<span style="font-size: 16px; color: #ffffff;">' +
item.value +
'</span>' +
'</p>';
});
return html;
},
},
series: [
{
type: 'bar',
name: '进局邮件数',
barGap: '30%',
itemStyle: {
color: new echarts.graphic.LinearGradient(0, 1, 1, 0, [
{
offset: 0,
color: 'rgba(23,242,195,1)',
},
{
offset: 1,
color: 'rgba(23,242,195,0.6)',
},
]),
},
barWidth: 8,
data: res.arriveMail.data,
markLine: {
lineStyle: { color: '#17f2c3', type: 'dashed' }, // 设置线的属性
data: [{ yAxis: res.arriveMail.markLineData }], // 设置线的y值 还可以设置显示文本等 具体见官网api
label: {
show: true,
position: 'insideEndTop',
color: '#17f2c3',
fontSize: 16,
padding: [0, 0, 10, 0],
fontStyle: 'oblique',
},
},
},
{
type: 'bar',
name: '出局邮件数',
label: {
show: false,
},
barGap: '30%',
itemStyle: {
color: new echarts.graphic.LinearGradient(0, 1, 1, 0, [
{
offset: 0,
color: 'rgba(255,240,146,1)',
},
{
offset: 1,
color: 'rgba(255,240,146,0.6)',
},
]),
},
barWidth: 8,
data: res.departMail.data,
markLine: {
lineStyle: { color: '#fff092', type: 'dashed' }, // 设置线的属性
data: [{ yAxis: res.departMail.markLineData }], // 设置线的y值 还可以设置显示文本等 具体见官网api
label: {
show: true,
position: 'insideEndTop',
color: '#fff092',
fontSize: 16,
padding: [0, 0, 10, 0],
fontStyle: 'oblique',
},
},
},
],
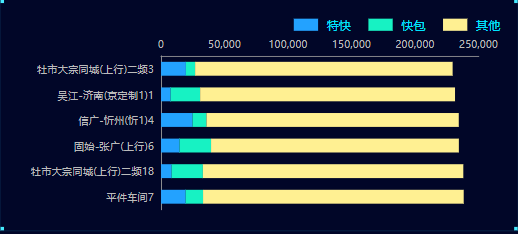
}柱状图类型(横向堆叠)
- 1.表现形式(横向堆叠)
- 2.配置
提示
堆叠图series下面stack要设置。 series下面数据分开写了,可以在上面处理数据做遍历,就可以根据对应的索引来赋值
js
// 接口数据
const res = {
data: [
[19384, 8326, 14575, 24820, 7528, 19551],
[13676, 24597, 24781, 10940, 23228, 7255],
[205219, 205045, 195110, 198633, 200686, 202752]
]
xAxisData: ["特快", "快包", "其他"],
yAxisData: ["平件车间7", "牡市大宗同城(上行)二频18", "固始-张广(上行)6", "信广-忻州(忻1)4", "吴江-济南(京定制1)1", "牡市大宗同城(上行)二频3"]
}
// 图表配置
const colorArr = ['rgba(35, 162, 255, 1)', 'rgba(23, 242, 195, 1)', 'rgba(255, 240, 146, 1)'];
option = {
legend: {
orient: 'horizontal',
icon: 'rect', //图例形状
data: res.xAxisData,
top: '12px',
right: '10',
itemWidth: 28, // 图例标记的图形宽度。
itemHeight: 14, // 图例标记的图形高度。
itemGap: 40, // 图例每项之间的间隔。
textStyle: {
fontSize: 14,
color: '#00E4FF',
padding: [0, 5],
},
},
grid: {
left: '80',
right: '40',
bottom: '4',
top: '60',
containLabel: false,
},
xAxis: {
type: 'value',
position: 'top',
splitLine: {
show: false,
},
axisTick: {
show: false,
},
axisLine: {
// 改变y轴颜色
show: true,
lineStyle: {
color: '#979797',
width: 1,
},
},
axisLabel: {
// 改变x轴字体颜色和大小
color: '#bbbbbb',
fontSize: 12,
},
},
yAxis: {
type: 'category',
data: res.yAxisData,
splitLine: {
show: false,
},
axisTick: {
show: false,
},
axisLine: {
show: true,
lineStyle: {
color: '#979797',
type: 'solid',
width: 1,
},
},
axisLabel: {
interval: 0,
color: '#bbbbbb',
fontSize: 12,
},
},
tooltip: {
trigger: 'axis',
backgroundColor: 'rgba(29,30,121,0.70)',
borderColor: 'rgba(29,30,121,0.70)',
padding: 0,
extraCssText: 'background: rgba(29,30,121,0.70)',
formatter: function (params) {
let html = ` <p style='background: #0C4D91;border-radius: 4px 4px 0 0; text-indent:9px;line-height: 30px;font-size: 16px; color: #FFFFFF;'>
${params[0].name}</p>`;
params.forEach((item) => {
const color = item.color.colorStops ? item.color.colorStops[0].color : item.color;
html +=
'<p style="margin-left:9px;margin-right:9px;line-height: 30px">' +
'<span style="display:inline-block;margin-right:4px;border-radius:50%;width:10px;height:10px;left:5px;background-color:' +
color +
'"></span>' +
'<span style="font-size: 16px; color: #17f2c3;">' +
item.seriesName +
' : </span>' +
'<span style="font-size: 16px; color: #ffffff;">' +
item.value +
'</span>' +
'</p>';
});
return html;
},
},
series: [
{
type: 'bar',
name: res.xAxisData[0],
barGap: '60%',
itemStyle: {
color: colorArr[0],
borderWidth: 2,
},
stack: '1',
barWidth: 16,
data: res.data[0],
},
{
type: 'bar',
name: res.xAxisData[1],
barGap: '60%',
itemStyle: {
color: colorArr[1],
borderWidth: 2,
},
stack: '1',
barWidth: 16,
data: res.data[1],
},
{
type: 'bar',
name: res.xAxisData[2],
barGap: '60%',
itemStyle: {
color: colorArr[2],
borderWidth: 2,
},
stack: '1',
barWidth: 16,
data: res.data[2],
}
],
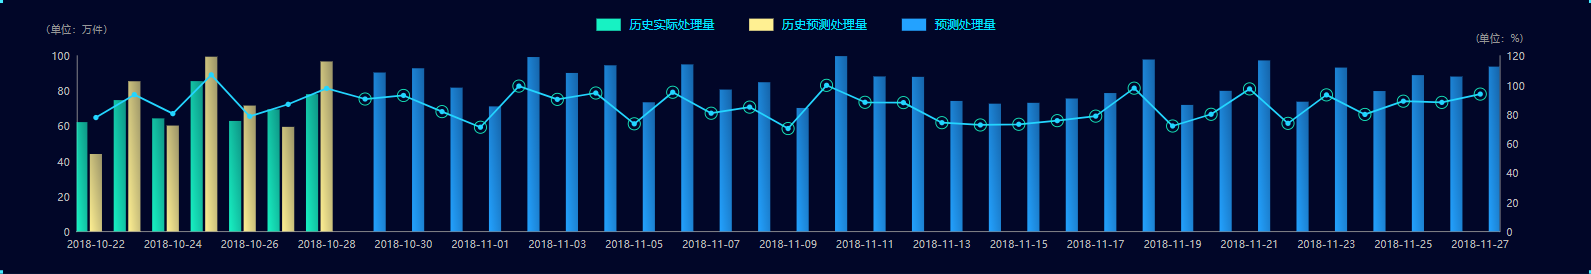
}柱状图类型(组合式自定义折线标注点)
- 1.表现形式(组合式自定义折线标注点)
- 2.配置
js
// 接口数据
const res = {
    date: ["2018-10-22","2018-10-23","2018-10-24","2018-10-25","2018-10-26","2018-10-27","2018-10-28","2018-10-29","2018-10-30","2018-10-31","2018-11-01","2018-11-02","2018-11-03","2018-11-04","2018-11-05","2018-11-06","2018-11-07","2018-11-08","2018-11-09","2018-11-10","2018-11-11","2018-11-12","2018-11-13","2018-11-14","2018-11-15","2018-11-16","2018-11-17","2018-11-18","2018-11-19","2018-11-20","2018-11-21","2018-11-22","2018-11-23","2018-11-24","2018-11-25","2018-11-26","2018-11-27"],
    futureProcessPressureForecast: [0,0,0,0,0,0,0,90.54,92.97,81.92,71.25,99.37,90.30,94.65,73.58,95.17,80.83,85.01,70.35,99.90,88.30,88.08,74.35,72.79,73.27,75.74,78.84,97.96,72.08,80.10,97.45,73.91,93.36,79.99,89.06,88.24,93.90],
    hisForecastMail: [441176,855704,603201,995608,717097,595786,968494,0,0,0,0,0,0,0,0,0,0,0,0,0,0,0,0,0,0,0,0,0,0,0,0,0,0,0,0,0,0],
    futureForecastMail: [0,0,0,0,0,0,0,905427,929712,819230,712490,993680,903020,946517,735760,951687,808272,850129,703548,998951,882996,880826,743514,727888,732681,757389,788397,979633,720835,801047,974475,739086,933592,799891,890612,882393,939009],
    historyMails: [622867,748258,644247,856546,629478,695449,782342,0,0,0,0,0,0,0,0,0,0,0,0,0,0,0,0,0,0,0,0,0,0,0,0,0,0,0,0,0,0],
    hisProcessPressure: [77.86,93.53,80.53,107.07,78.68,86.93,97.79,0,0,0,0,0,0,0,0,0,0,0,0,0,0,0,0,0,0,0,0,0,0,0,0,0,0,0,0,0,0]
}
 let leftArray = [];
for (let i = 0; i < res.hisProcessPressure.length; i++) {
    if (res.hisProcessPressure[i] !== 0) {
        let obj: IlineItem = {
            value: res.hisProcessPressure[i] as number,
            symbol: 'circle',
            title: '历史',
            symbolSize: [6, 6],
        };
        leftArray.push(obj);
    }
}
let rightArray = [];
for (let i = 0; i < res.futureProcessPressureForecast.length; i++) {
    if (res.futureProcessPressureForecast[i] !== 0) {
        let obj: IlineItem = {
            value: res.futureProcessPressureForecast[i] as number,
            symbol: 'image://' + circleImg,
            title: '预测',
            symbolSize: [16, 16],
        };
        rightArray.push(obj);
    }
}
// 图表配置
option = {
    color: ['#17f2c3', '#fff092'],
    legend: {
        icon: 'rect', //图例形状
        data: [
            { name: '历史实际处理量', itemStyle: { color: '#17f2c3' } },
            { name: '历史预测处理量', itemStyle: { color: '#fff092' } },
            { name: '预测处理量', itemStyle: { color: 'rgba(35, 162, 255, 1)' } },
        ],
        // rgba(255, 240, 146, 1)
        top: '12px',
        itemWidth: 28, // 图例标记的图形宽度。
        itemHeight: 14, // 图例标记的图形高度。
        itemGap: 40, // 图例每项之间的间隔。
        textStyle: {
            fontSize: 14,
            color: '#00E4FF',
            padding: [0, 5],
        },
    },
    tooltip: {
        trigger: 'item',
        backgroundColor: 'rgba(29,30,121,0.70)',
        borderColor: 'rgba(29,30,121,0.70)',
        padding: 0,
        extraCssText: 'background: rgba(29,30,121,0.70)',
        formatter: function (params) {
        let html = '';
        if (params.seriesType === 'bar') {
            html = ` <p style='background: #0C4D91;padding-right: 12px;border-radius: 4px 4px 0 0; text-indent:9px;line-height: 30px;font-size: 16px; color: #FFFFFF;'>
            ${params.seriesName}</p>`;
            if (params.value !== 0) {
                html +=
                    '<p style="margin-left:9px;margin-right:9px;">' +
                    '<span style="display:inline-block;margin-right:4px;border-radius:50%;width:10px;height:10px;left:5px;background-color:' +
                    params.color.colorStops[0].color +
                    '"></span>' +
                    '<span style="font-size: 16px; color: #23D5FF;">' +
                    params.name +
                    ' : </span>' +
                    '<span style="font-size: 16px; color: #ffffff;">' +
                    params.value +
                    '万件</span>' +
                    '</p>';
            }
        } else if (params.seriesType === 'line') {
            html = ` <p style='background: #0C4D91;padding-right: 12px;border-radius: 4px 4px 0 0; text-indent:9px;line-height: 30px;font-size: 16px; color: #FFFFFF;'>
            ${params.seriesName}(${params.data.title})</p>`;
                if (params.value !== 0) {
                    html +=
                        '<p style="margin-left:9px;margin-right:9px;line-height: 30px">' +
                        '<span style="display:inline-block;margin-right:4px;border-radius:50%;width:10px;height:10px;left:5px;background-color:' +
                        params.color +
                        '"></span>' +
                        '<span style="font-size: 16px; color: #23D5FF;">' +
                        params.name +
                        ' : </span>' +
                        '<span style="font-size: 16px; color: #ffffff;">' +
                        params.value +
                        '万件</span>' +
                        '</p>';
                }
            }
            return html;
        },
    },
    grid: {
        left: '3%',
        right: '4%',
        bottom: '3%',
        containLabel: true,
    },
    xAxis: [
        {
            type: 'category',
            data: res.date,
            splitLine: {
                show: false,
            },
            axisTick: {
                show: false,
            },
            triggerEvent: true,
            axisLine: {
                //  改变y轴颜色
                show: true,
                lineStyle: {
                    color: '#979797',
                    width: 1,
                },
            },
            axisLabel: {
                //  改变x轴字体颜色和大小
                color: '#bbbbbb',
                fontSize: 12,
            },
        },
    ],
    yAxis: [
        {
            type: 'value',
            name: '(单位:万件)',
            nameTextStyle: {
                padding: [0, 0, 10, 0],
            },
            splitLine: {
                show: false,
            },
            axisTick: {
                show: false,
            },
            axisLine: {
                show: true,
                lineStyle: {
                    color: '#979797',
                    type: 'solid',
                    width: 1,
                },
            },
            axisLabel: {
                interval: 0,
                color: '#bbbbbb',
                fontSize: 12,
            },
        },
        {
            name: '(单位:%)',
            type: 'value',
            min: 0,
            splitLine: {
                show: false,
            },
            axisTick: {
                show: false,
            },
            axisLine: {
                show: true,
                lineStyle: {
                    color: '#979797',
                    type: 'solid',
                    width: 1,
                },
            },
            axisLabel: {
                interval: 0,
                color: '#bbbbbb',
                fontSize: 12,
            },
        },
    ],
    series: [
        {
            name: '历史实际处理量',
            type: 'bar',
            emphasis: {
                focus: 'series',
            },
            yAxisIndex: 0,
            barWidth: 14,
            itemStyle: {
                color: new echarts.graphic.LinearGradient(0, 1, 1, 0, [
                    {
                        offset: 0,
                        color: 'rgba(23,242,195,1)',
                    },
                    {
                        offset: 1,
                        color: 'rgba(23,242,195,0.6)',
                    },
                ]),
            },
            data: res.historyMails,
        },
        {
            name: '历史预测处理量',
            type: 'bar',
            emphasis: {
                focus: 'series',
            },
            yAxisIndex: 0,
            barWidth: 14,
            itemStyle: {
                color: new echarts.graphic.LinearGradient(0, 1, 1, 0, [
                    {
                        offset: 0,
                        color: 'rgba(255,240,146,1)',
                    },
                    {
                        offset: 1,
                        color: 'rgba(255,240,146,0.6)',
                    },
                ]),
            },
            data: res.hisForecastMail,
        },
        {
            name: '预测处理量',
            type: 'bar',
            emphasis: {
                focus: 'series',
            },
            yAxisIndex: 0,
            barWidth: 14,
            itemStyle: {
                color: new echarts.graphic.LinearGradient(0, 1, 1, 0, [
                    {
                        offset: 0,
                        color: 'rgba(35, 162, 255, 1)',
                    },
                    {
                        offset: 1,
                        color: 'rgba(35, 162, 255, 0.6)',
                    },
                ]),
            },

        data: res.futureForecastMail,
        },
        {
            name: '处理压力',
            type: 'line',
            stack: 'Total',
            yAxisIndex: 1,
            emphasis: {
                focus: 'series',
            },
            itemStyle: {
                color: '#23d5ff',
            },
            data: [...leftArray, ...rightArray],
        },
    ],
}